10-year snapshot: median price trend at a glance
A decade tells the real story, and Los Angeles delivered sizable gains from 2015 through 2021, a surge in 2022, a breather in 2023, and a new plateau through 2025. The long run shows prices rising faster than wages, yet 2025 brought steadier month-to-month moves as rates eased from 2024 highs. Even after cooling from peaks, the typical seller still holds strong equity built over the past ten years. Buyers who entered in 2020 or earlier often sit on significant appreciation, which shapes move-up behavior and supply. The data points to resilience in the CA Housing Market rather than a bubble.
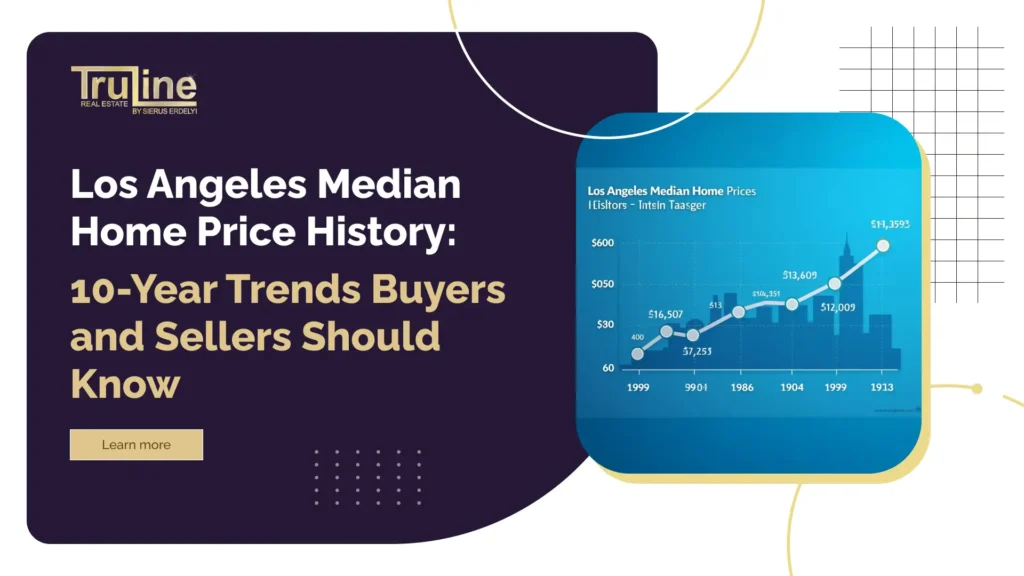
Median sale price vs list price over the decade
List prices rose along with demand, but the sale-to-list relationship changed as rates jumped after 2021. Early decade years saw closer to full-price outcomes in hot zip codes, while 2023 and early 2025 showed more negotiation room as inventory inched up. In spring spikes, well prepped homes still fetch near or above list in coveted school zones and walkable pockets. By contrast, stale listings near heavy traffic or with dated interiors need a decisive price reset or thoughtful credits. Pricing to the last validated comp beats testing a stretch number that invites long days on market.
Inflation-adjusted price trend for real dollars
When you adjust for inflation, the last decade still posts real gains, yet the slope flattens. Prices that looked explosive in nominal terms look more measured in 2015 dollars, especially after 2022. Real-dollar views help buyers set expectations on future appreciation and help sellers avoid anchoring to one headline month. Use this lens to sanity check comps, since nominal peaks can hide softer real growth. In practice, both parties win when they weigh real-dollar trends alongside current mortgage math.
Peaks, troughs, and recoveries since 2015
Los Angeles saw steady climbs through 2018, a pause in 2019, then a powerful run-up from mid 2020 through mid 2022. The market cooled through 2023 as rates climbed, then stabilized with flatter monthly prints into 2025. Neighborhoods with new or renovated supply held value best during cooldowns, as buyers paid premiums for move-in-ready homes. Submarkets tied to long commutes or construction noise saw longer market times until pricing aligned with new realities. The recovery pattern tracked mortgage costs and local job headlines more than national talk.
How Los Angeles real estate market trends compare statewide
Within the CA Housing Market, Southern California moves in sync with Los Angeles but shows wide gaps between coastal and inland counties. Los Angeles sits above the state median and below super-prime San Francisco Bay Area price points. Riverside County and San Bernardino County respond faster to rate shifts because entry-level buyers feel payment changes first. Santa Barbara County and San Luis Obispo show coastal scarcity that protects values even in slow seasons. The net effect puts Los Angeles in a balanced posture, supported by demand depth across America’s second largest metro.
Move smarter with Truline Realty
At Truline Realty, we help you read the Los Angeles Metro Area numbers and turn them into a clear plan for your street. Our services at Truline Realty include full buyer representation, pinpoint pricing, and private showings that never hit portals. Start with our Search LA Homes for Sale tool to track live inventory and comps, then pair it with our Sell My Home in LA strategy when you want to list with confidence. First-time buyers can use our First-Time Home Buyer in Los Angeles program, and investors who hold property can lean on our Property Management Services to protect NOI. We keep you focused on decisions that hold up after close, not hype.
Los Angeles real estate market trends: the drivers to track
Local price action follows a handful of drivers you can monitor monthly. Jobs and income trends signal purchasing power. Migration and household formation steer demand by ZIP code. New supply through building, ADUs, and infill changes neighborhood dynamics. Policy changes, fees, and permitting timelines influence both pace and cost to deliver homes. Track these drivers to read where pricing heads next, and weigh them against any Inventory Index you follow.
Jobs and income growth vs prices
High wage sectors such as entertainment, tech, and healthcare fuel down payments and stretch bids in Westside and Valley pockets. Wage growth trails housing costs over the decade, which caps how far buyers can push payments. Employers that expand in-office days lift premiums near job centers and transit corridors. Layoffs or hiring freezes can ripple into price cuts on the margins, especially for condos close to downtown. Follow payroll reports and industry news if you plan a move in the next two quarters.
Migration, household formation, and new supply
People still move into Los Angeles for work and lifestyle, and they form new households at a steady clip. Outbound moves toward lower cost metros ease some pressure, but inflows to select neighborhoods keep activity brisk. New multifamily deliveries add rental options, which can cool rent growth and nudge some renters into buying when concessions rise. Single-family construction lags demand, so ADUs and small-lot infill carry outsized weight. Watch permit dashboards and lease-up activity to sense how supply changes may hit your block.
Investor share and second-home demand
Investor activity ebbs and flows with rates, cap rates, and rent expectations. Lower rates can bring back financed investors who paused in 2023, while cash buyers stay active in trophy areas. Second-home interest often tracks wealth effects from markets and tech, lifting demand for view homes and beach-close properties. Investor listing quality varies, so owner-occupants can win value by bidding on dated rentals and adding smart renovations. The mix of investor and end-user demand shapes pricing power by micro-area.
Policy shifts, zoning, and permitting impacts
City and state policy changes affect timelines, fees, and what you can build on a lot. Zoning updates that allow more units near transit and reforms that streamline ADUs add incremental supply over time. Transfer taxes on high-value deals affect the luxury tier and can alter move-up math for sellers above certain thresholds. Faster permit paths in targeted corridors can pull forward new listings and reshape comps. Policy risk also shows up in insurance pricing near Wildfire corridors, which buyers and lenders now factor into offers.
Data and methods: how we define “median price” in L.A.
Clear definitions matter because a median can shift when the mix of homes changes. The median is the middle point of all closed sales in a period, where half sold for more and half sold for less. It differs from an average, which skews upward when a few very high sales hit. Indexes like Case-Shiller track repeat sales to smooth out mix shifts, while medians reflect what actually closed. We use medians for practical pricing, then cross-check against indexes when the mix looks unusual.
Sources for Los Angeles median home price history
Reliable medians come from the California Association of Realtors, regional associations, county releases, and MLS feeds with a clear Reference ID for each closing. Monthly and annual Sales Data tables show both county-level snapshots and metro summaries. Third-party portals supply Home Data on time-to-pending, rent trends, and share of over-ask sales. State releases add inventory and days-to-sell context you can pair with the Inventory Index you track. Combining these sources gives a clearer picture than any single chart. Cross-check trends with the FHFA House Price Index and the BLS Los Angeles Area Economic Summary, then use our explainer on understanding MLS real estate listings to read comps like a pro.
Why medians differ from averages and indices
Medians handle outliers better than averages, which can jump on just a few ultra-luxury closings. Repeat-sales indexes smooth volatility but lag the moment and exclude many properties. For pricing today, the median reflects what the next buyer will likely pay. For long-term appreciation, repeat-sales indexes provide a cleaner growth arc. Smart analysis uses both and checks the mix of condos, single-family homes, and price tiers, including price per square Footage to avoid mix errors.
City vs county vs neighborhood boundaries explained
Los Angeles City sits inside Los Angeles County, and each has different medians. Neighborhoods and ZIP codes sit inside the city or county, and they show sharper swings due to small sample sizes. When you read a stat, confirm whether it references the city, the county, or the Los Angeles Metro Area. A county median can look stable while one neighborhood surges because a new school draw builds heat. Your plan should match the boundary your target home lives in.
Year-by-year: 2015 to 2025 price changes in one view
A simple look across the last decade shows the climb from mid 2010s levels to today’s higher plateau. The 2020 to 2022 window posted the fastest gains as rates fell and buyers chased space and amenities. 2023 cooled as rates reset, then 2024 and 2025 found a steadier channel with smaller monthly changes. Even so, mid 2025 medians sat well above 2019 and earlier readings. That gap explains why equity-rich owners still shape supply and Home Ownership decisions.
The biggest annual jumps and slowdowns since 2015
The strongest year-over-year gains clustered in the early pandemic rebound and the peak of remote work demand. Slowdowns followed rate spikes and affordability walls, which pushed buyers to the sidelines and extended days on market. Annual declines tended to be shallow and short, especially in submarkets with limited listings and high walk scores. Renovated homes held price better than fixers during soft patches, which sharpened the quality premium. Finance costs overpowered mood in the short run, then receded as buyers adjusted.
The pandemic run-up and post-2022 cooldown
Once remote work took hold, buyers paid more for yards, home offices, and outdoor space. As rates lifted in 2022 and 2023, budgets bent and buyers shifted to condos or smaller footprints. The market then found a middle path in 2024 and 2025 with fewer bidding wars but fast sales for turnkey homes. Sellers who priced to the last clean comp and invested in prep still won strong outcomes. The fever broke, yet fundamentals held across diverse parts of America.
2025 year-to-date trend in context
Through mid 2025, medians bounced inside a narrow band while rates eased from earlier highs. Days to pending drifted between three and five weeks for most city neighborhoods, with the Westside often moving faster on best-in-class listings. Price cuts rose on stale or mispriced homes, which brought value hunters back into the mix. Credit strategies like points and buydowns helped buyers solve payment math and helped sellers hold price. The year reads as a reset toward normal seasonality, not a cliff.
Neighborhood trends: Westside to Valley to South Bay
Submarket patterns matter more than any single county median. The Westside, select Beverly Hills pockets, and beach cities command premiums for schools, access, and lifestyle. The San Fernando Valley and Conejo corridors offer bigger lots and value plays within strong districts. The Eastside and Northeast L.A. continue to draw creatives and first-time buyers who want character and transit links. Downtown and San Gabriel Valley present mixed reads that hinge on building quality and commute needs.
Westside and Beverly Hills price paths
Westside medians sit well above the county level due to scarce land and luxury demand. Walkable nodes near Palisades, Brentwood, and Santa Monica set the tone for design and finishes. Beverly Hills remains a global brand market, where pricing follows both local comps and international wealth trends. Renovated mid-century and new contemporary builds see deep buyer pools when they pair privacy with views. Listing quality and presentation decide whether a home sells fast at a premium or lingers. See current Beverly Hills homes for sale and micro-areas like The Flats and The Summit to gauge today’s asking ranges.
San Fernando Valley and Conejo shifts
The Valley trades on space, schools, and backyard living. Neighborhoods with strong district reputations still post multiple offers for crisp listings in spring. Farther north and west, value buyers stretch for larger homes that fit multigenerational living. Conejo’s family-friendly mix and trail access keep demand steady from move-up buyers. Builders and renovators who deliver energy efficiency and smart storage win the widest audience.
Eastside and Northeast L.A. momentum
Eastside charm, historic zones, and transit access continue to pull buyers from pricier Westside markets. Thoughtful restorations of craftsman and Spanish homes command premiums. Condos near retail corridors serve first-time buyers who want shorter commutes and community energy. Pocket parks and bikeable streets add value that comps do not always capture on paper. This momentum stays durable when pricing respects appraisals and recent nearby sales.
South Bay, DTLA, and San Gabriel Valley contrasts
Beach city homes sell on light, air, and lifestyle access, while inland South Bay offers budget relief with strong schools. Downtown condos show split performance that depends on building reserves, amenities, and assessment history. San Gabriel Valley neighborhoods swing with school rankings and transit projects that reshape access. Newer product near job hubs can outsell larger but dated homes farther out. Each area sets its own tempo, so plans should fit the block, not the county headline. For a Westside baseline, survey homes for sale in West LA.
Beverly Hills flats vs hills micro-trends
The flats attract buyers who prize walkability to shops and schools, which tightens days on market in spring. The hills trade on privacy, views, and lot size, which widens price bands based on access and grading. Security, gated streets, and architectural pedigree matter more in the hills than in the flats. Renovation scope drives outcomes in both, but the flats reward curb appeal and family-friendly layouts. Pre-market access gives a decisive edge when a rare home surfaces.
Price tiers: entry-level, mid-range, and luxury splits
Price tiers behave differently as rates move. Entry-level homes respond first to payment changes and tend to show the most competition in spring. Mid-range move-up listings track school calendars and job moves, which create steady demand. Luxury above two million lives on quality, privacy, and brand streets, and responds slower to rate changes. Reading tier gaps helps both sides set realistic goals and avoid appraisal friction.
Entry-level homes under the city median
Starter buyers watch monthly payment math more than any other segment. Points, buydowns, and lender credits can make or break their offers. Homes near transit and strong elementary zones draw deep pools of first-time buyers. Sellers can win with clean prep and flexible close dates that solve renter move-out timing. Early inspections and clear disclosure reduce renegotiations and keep deals intact.
Move-up homes in the mid-range
Move-up buyers often carry equity and need larger spaces or new locations for schools. These shoppers favor turnkey homes that reduce the stress of moving and settling. Flexible rent-backs and clear possession plans help both sides align schedules. Pricing close to the last validated comp keeps appraisals clean and loan timelines smooth. The mid-range sets the market’s tone because it trades most months of the year.
Luxury segment above two million
Luxury buyers pay for privacy, architecture, and amenities like gyms, theaters, and wellness spaces. They expect concierge showings and discreet negotiations, especially for off-market or coming-soon listings. Transfer taxes and carrying costs shape decision timing more than small rate moves. Global wealth flows and stock market moods can pull new bidders into trophy streets without warning. Sharp marketing, quiet outreach, and airtight legal work separate average outcomes from standout sales.
What price-tier gaps tell buyers and sellers
When the spread between entry and mid narrows, move-up buyers act quickly to capture added space. When luxury pulls back while mid holds firm, high-end buyers can find value on signature streets. Tier spreads also signal where appraisals may pinch, so plan your price and credits with that in mind. Buyers should hunt edges where a home sits just under a tier break. Sellers should list where the most qualified buyers cluster, not at a number that cuts the audience in half.
Property types: single-family vs condo and townhome
Property type changes the path to value, timing, and risk. Single-family homes carry yard and school benefits that hold price in most cycles. Condos and townhomes trade on location, amenities, and HOA health. New builds promise efficiency and warranties, while resales can offer charm and larger lots. Your choice should match lifestyle and budget more than any headline metric.
Single-family homes: yard and school district effects
Backyard space, privacy, and school access keep single-family medians above condos in most neighborhoods. Families pay premiums for quiet streets, bedroom counts, and floor plans that handle work and play. Renovations that add storage, mudrooms, and outdoor kitchens return value when done cleanly. Zoning and ADU potential add hidden equity paths that buyers should evaluate before bidding. Sellers who invest in curb appeal and pre-list repairs see faster, cleaner offers.
Condos and townhomes: amenity and HOA impacts
Condos compete on location and amenities such as pools, gyms, and concierge services. HOA strength matters as much as the unit, since reserves, litigation, and special assessments affect financing and resale. Buyers should read minutes, budget summaries, and rules before they fall in love with the view. Buildings with fresh systems and stable dues attract both first-time buyers and downsizers. Sellers should surface documents early to keep escrow smooth. For deeper due diligence, use our Silver Lake condo buying guide.
New build vs resale performance
New homes draw buyers who want energy efficiency, warranties, and modern layouts. Resales can beat new builds on lot size, character, and street appeal. In soft patches, builders use credits and rate buydowns that private sellers can match with targeted concessions. Resale sellers who pre-inspect and stage close the gap by reducing buyer uncertainty. Both paths work when the pricing and terms fit current demand.
Seasonality: spring jumps, summer peaks, winter dips
Seasonal patterns still shape outcomes even as rates and news cycle churn. Spring listings draw the widest pool of buyers and set many of the year’s top comps. Summer holds strong in beach and school-driven neighborhoods. Fall slows as families settle and holidays approach, which creates value windows for patient buyers. Winter dips often present the best chance to buy with fewer bidders and more flexible terms.
Best months to list for top dollar
Late March through early June delivers the deepest buyer activity for most single-family homes. Families who want to move before the new school year push bids higher during this window. Professional photos, twilight shots, and polished copy matter more when competition peaks. Sellers should complete repairs and landscaping before listing week to catch the first weekend surge. Pricing to the last strong comp keeps momentum and avoids mid-escrow drama. If you plan to sell, study our step-by-step guide Sell My Home in LA and sync your timeline with our Sell My Home in LA service.
Best months to buy with less competition
Late October through mid December often brings fewer bidders and more negotiable terms. Homes that linger after summer may accept credits for rate buydowns or closing costs. Buyers who carry strong pre-approvals and fast inspection timelines can win value without rushing. Condos near urban cores show the largest late-year flexibility when commuter demand eases. Cash reserves for repairs unlock even more leverage in these months.
Holiday slowdown and how to use it
Thanksgiving through New Year’s Day sees fewer new listings, yet motivated sellers still want deals done. Use that window to request credits, flexible closings, and appliance packages. Keep your lender and inspector on call, since fast turnarounds win when others take time off. Prep your paperwork ahead of time so you can sign quickly if a match appears. Small advantages stack up during the quiet weeks.
Rates and payments: how mortgages changed buying power
Rates drive the monthly payment that rules most purchase decisions. As rates eased in mid 2025 from prior peaks, more buyers re-entered searches and revived stalled plans. Payment math still runs higher than in 2021, so buydowns, points, and ARMs returned to the toolbox. Sellers who understand buyer financing can structure deals that protect price while solving budget pain. The right loan strategy often decides who wins a bidding contest.
Mortgage rate swings and monthly payment math
A one point move in rate can add or remove hundreds of dollars from a typical monthly payment. Buyers should run scenarios that include taxes, insurance, HOA, and any Wildfire or flood insurance riders. Rate locks matter, and timing a lock to the right week can save real money. Sellers benefit when they pair strong pricing with credit options that widen the buyer pool. Both sides win when the payment feels sustainable.
Rate buydowns, ARMs, and discount points in practice
Temporary buydowns shift payment relief into the first two or three years and help buyers step into ownership. ARMs can fit shorter holding plans when caps and indexes align with risk tolerance. Discount points make sense when you plan to stay long enough to pass the breakeven month. Sellers can fund credits that buy points in exchange for a higher contract price that still appraises. Lenders and agents should coordinate early so the math supports the offer.
Lock-in effect and move-up seller decisions
Owners with sub four percent loans think twice about listing unless life events push a move. That lock-in effect limits supply and supports prices even when rates run high. Move-up sellers solve the gap by keeping the first home as a rental or by using bridge loans. Creative terms like rent-backs and delayed possession can ease the transition. Clear plans reduce risk and keep timelines tight.
Affordability: wages, price-to-income, and cost to own
Affordability includes more than the mortgage. Property taxes, insurance, HOA dues, and maintenance round out the true monthly. Wages rose, but not as fast as housing, so buyers recalibrated budgets and neighborhoods. House hacking with a rentable ADU helps some owners offset costs. Use our website calculation checklist to model full carrying costs before you write an offer.
Price-to-income and debt-to-income checkpoints
Buyers should test price-to-income ratios alongside lender DTI rules to avoid tight cash flow. Conservative limits leave room for repairs and rate changes at renewal. Household budgets that include commuting and childcare line items spot the real monthly faster. Sellers who understand these constraints accept clean offers with fewer contingencies over slightly higher but risky numbers. Realistic math keeps deals together through appraisal and underwriting.
Property taxes, insurance, and HOA as real costs
Taxes and insurance changed fast in some zip codes, which surprised buyers who only watched rates. Insurance premiums rose near Wildfire zones and hillside areas, which shifted monthly budgets. HOA fees can climb with new reserves or major repairs, and those increases hit monthly comfort. Smart shoppers request insurance quotes and HOA docs before they fall in love with the staging. Sellers who disclose early prevent cancellations and protect momentum.
House hacking and ADUs to offset payments
Owners add ADUs or rent spare bedrooms to counter higher mortgage costs. Long-term rentals fit most policies better than short-term stays and stabilize cash flow. Design choices such as privacy entries and sound insulation make the setup smoother for everyone. Buyers can underwrite a deal using conservative rent assumptions and still find relief. Lenders who count rental income expand the options for qualified borrowers.
Inventory and days on market: what signals to watch
Inventory sets the stage for pricing power and negotiation. Months of supply around three to four points to a balanced yet firm market for sellers. Median days to pending near three to five weeks tell you how fast to prepare and bid. Price reductions cluster where sellers overreach, which shows where value hides. Pair these reads with any Inventory Index series you track for a cleaner signal.
Months of supply and new listings trend
Rising months of supply widen buyer choice and slow list-to-close timelines. New listings that stack up in one school zone often hint at a pricing reset. Sharp reductions can reset comps and invite fresh traffic. Sellers should watch pending counts rather than only active counts to gauge true demand. Buyers can time offers right after meaningful cuts appear.
Median days to pending across submarkets
Hot pockets post sub three week pendings in spring, while slower corridors stretch past five weeks. A clean, move-in-ready home compresses timelines even in cooler areas. Buyers should match showing pace to the local pending tempo so they do not miss the window. Sellers can pre-announce to agents and build momentum into the first weekend. Momentum at launch often beats a later price cut.
How to read price reductions and relists
A cluster of price cuts signals either mispricing or a seasonal shift. Relists with fresh photos and copy can revive interest if the pricing now matches the market. Buyers should check listing history to spot leverage or to avoid stale traps. Sellers should avoid small, repeated trims that teach the market to wait. One decisive correction works better than a drip.
Competition: over-ask sales, price cuts, and concessions
Bidding wars did not vanish, but they narrowed to the best listings and school zones. Many homes still sell near asking, and a meaningful share sell over list in the most coveted pockets. Price cuts rose on mispriced homes, especially condos with HOA issues or dated finishes. Credits for points, closing costs, and repairs now settle many disputes. Both sides benefit when they negotiate terms that fit the property rather than chase a headline.
Share of homes sold over asking
Strong listings in prime pockets push over-ask outcomes, especially in spring. That share varies by submarket and season, yet it still signals buyer depth. Buyers who bring clean offers with limited asks often edge out slightly higher but messy bids. Sellers should set list price just under the last sharp comp to spark multiple offers. Over-ask happens when prep, price, and marketing meet real demand.
Concessions, credits, and inspection trends
Inspection credits rose as buyers fought higher payments and surprise repair lists. Sellers now budget for minor fixes and targeted credits that keep appraisals clean. Pre-inspections and clear disclosure lower the chance of late-stage drama. Buyers should request health and safety items first and leave cosmetic swaps for later. Both sides close smoother when they set expectations in writing early.
Appraisal gaps and bridge loans
Tight appraisals happen when prices move faster than closed comps. Buyers solve gaps with extra cash, appraisal contingency tweaks, or a second opinion from a local lender panel. Bridge loans ease timing for move-up sellers who found the next home before selling the current one. Agents and lenders who game plan before offer day avoid rushed, risky choices. Clear financing strategies can rescue great deals from small valuation gaps.
New construction and ADUs: supply that moves the needle
New construction adds options in targeted corridors, while ADUs add quiet density to single-family streets. Both forms of supply change comps and rental math at the block level. Builders move inventory with credits and rate incentives when absorption slows. Homeowners use ADUs to create income or space for family, which widens their choices without leaving a beloved street. Watch permits and model-home traffic to see where pricing may bend.
Where new supply is coming online
Most new single-family supply clusters on the edges, while infill townhomes and small-lot homes pop up near transit. Multifamily towers deliver downtown and in select mixed-use hubs. Renovation-heavy streets feel new again as dated homes flip to modern standards. This patchwork of supply affects pricing within a few blocks, not just by city. Local eyes on the ground catch these shifts first.
How ADUs change neighborhood pricing
ADUs turn single lots into small income properties that attract investors and multigenerational buyers. A well executed ADU does more than raise value. It broadens the buyer pool and reduces ownership cost for families. Blocks with many ADUs can see tighter resale supply because owners keep the main home and rent the ADU. Buyers should vet permits and craftsmanship so the rental income holds.
Permit trends to watch
Permit volumes signal future listings and rental supply. Faster approvals near transit and mixed-use zones point to earlier impacts on comps. Fee updates and code changes can slow or speed activity for months at a time. If you plan an addition or ADU, check timelines before you buy so holding costs make sense. Sellers should reference legal permits in marketing to protect price.
Rent vs buy in Los Angeles: 2025 math for households
Renters gained leverage as new apartments hit the market, yet buying still builds long-term equity when timelines stretch. The break-even horizon varies by neighborhood, price, and rate, but many households see the math favor ownership beyond a seven to nine year hold. In the near term, renters can use concessions to save and build a down payment. Buyers can use credits and buydowns to close the payment gap. Both paths can work when you shape them to your life stage and street.
Break-even horizon by neighborhood
High-price beach and hills markets often need longer holds to beat renting, while mid-price Valley and Eastside pockets cross over sooner. Property tax and insurance differences shift the curve more than many buyers expect. HOA-heavy buildings may delay the break-even point compared with fee-simple homes. Shaving rate with points or an ARM can bring the crossover forward by years. Use a model that includes maintenance and realistic rent growth.
Rent growth vs home price growth since 2015
Rents climbed through the decade, then cooled as new supply delivered in 2024 and 2025. Home prices outpaced rents in peak periods, which widened price-to-rent ratios in coastal pockets. As rent growth cooled, some renters stayed put longer to bank savings. Owners saw steady equity growth that renting does not deliver. The pattern supports buying when your horizon runs long enough to ride a full cycle.
When renting makes more sense in 2025
Short timelines, uncertain job moves, or large non-housing goals can favor renting. Households that want ultra-prime school zones but cannot stretch the down payment may rent and keep saving. Renters who land strong concessions can build cash faster than buyers who stretch. You can also rent near work and buy a value home to hold as a rental. Flexible strategies lower risk and preserve options.
2026 outlook scenarios: what could push prices up or down
The next year depends on rates, jobs, and supply. If rates drift lower and inventory stays tight, prices can edge up as more buyers return. If rates stay higher for longer while listings climb, buyers gain leverage and prices stay flat or slip in select pockets. A life-event supply surge could briefly boost active counts, but the lock-in effect limits large waves. Your plan should fit multiple paths, not a single bet on a headline.
Rate-drop soft landing scenario
Lower rates lift monthly affordability and pull more buyers into the pool. Sellers who deferred moves may finally list, which adds supply yet keeps pace with demand. Prices grind higher in prime school zones where supply cannot catch up. Payment relief also helps appraisals land cleanly, which reduces deal friction. In this path, move-up chains click back into gear.
Higher-for-longer rates scenario
If rates stick near current levels, buyers stay selective and credits stay common. More price cuts hit stale listings, especially condos that need big repairs. Sellers who price to comp and deliver turnkey quality still win fast outcomes. Days on market lengthen where commute pain or noise undercut value. In this path, patience and prep beat speed.
Supply surge from life events scenario
Retirements, relocations, and family changes can push new listings into the market at once. The surge would widen choices and soften prices in a few corridors. Buyers could win larger credits and better inspection outcomes during the surge. Sellers should move quickly to launch once the next home appears, before active counts pile up. Quick, decisive planning protects equity in this path.
Buyer playbook: how to use these trends street by street
Turn market knowledge into an offer that sticks. Get underwritten pre-approval, know your lock options, and pick a lender who can close on time. Build a neighborhood shortlist and study micro-comps within six blocks. Shape contingencies to the property and seller goals, not a template. Ask your agent for off-market and pre-market intel that never hits portals.
Pre-approval, rate strategy, and offer terms
An underwritten pre-approval signals strength and speeds escrow. Lock strategy matters, so align it with your search window and volatility. Offer clean terms with reasonable timelines, clear deposits, and proof of funds. Use credits and points to solve payment math without slicing price. Clarity wins more often than bravado.
Neighborhood shortlist and micro-comp analysis
Pick three target micro-areas and track every new listing, price cut, and pending. Walk the blocks at different times to gauge noise, parking, and traffic. Pull the last five closed comps that truly match size, lot, Footage, and condition. Note school assignments, insurance risks, and permit history because buyers and appraisers care. Build your shortlist with our Communities pages and pull live comps from Search LA Homes for Sale, then scan our blog on best neighborhoods to buy in 2025 for ground truths. This level of detail uncovers value and avoids bad surprises.
Contingencies that still win offers
Inspection and appraisal contingencies still win when they come with tight timelines and clear intent. A short loan contingency works when your lender pre-underwrites. Waiving repairs entirely can backfire, so use credits to handle issues without delay. Include a fair rent-back if the seller needs time to move. Terms that solve human needs beat tiny price bumps.
Seller playbook: pricing, prep, and list timing that works
The best sellers sell a story backed by clean paperwork and pro visuals. Price just below the last validated comp to build momentum. Fix the small stuff, service systems, and stage for light and flow. Launch on a Thursday, stack showings into the weekend, then review on Monday. Keep your disclosures tight to avoid renegotiations.
Smart pricing to the last validated comp
Confirm the last apples-to-apples comp within a tight radius before you set list. Adjust for lot, condition, Footage, and school boundaries with discipline. If you push higher, prepare for a fast correction if traffic lags. A bold list that misses the market costs more than a measured list that sparks multiple offers. Precision pays in days, not weeks.
Pre-list repairs, staging, and media that move
Fix leaks, squeaks, and safety issues before photos. Hire a stager who understands your target buyer and the neighborhood aesthetic. Pro photos and a true-to-life video tour increase qualified showings. Floor plans help buyers visualize and speed decisions. The right prep turns a good house into a must-see listing.
Offer review strategy and backup offers
State your review plan in the remarks and share updates with buyer agents. Use a fair window for inspections and stick to response deadlines. Keep a signed backup offer to protect against late surprises. Reward clean, well qualified offers with clear communication. Discipline at this stage keeps the close on schedule.
How to handle multiple-offer weekends
Set expectations before launch and honor them as the offers come in. Ask for best and final by a set time, then review with a tight matrix of price, terms, and certainty. Use counteroffers to clean up timelines rather than chase tiny price wins. Thank every bidder so you can call them if the top deal wobbles. Professionalism now builds a pipeline for your next listing.
What this means for you with Truline Realty
You want decisions that hold up after closing. Our advisors track weekly data by neighborhood, not just county medians. We share private and pre-market opportunities that never hit portals. Our founder’s legal background adds another layer of protection when contracts get complex. We bring concierge prep for sellers and street-level scouting for buyers so you move with confidence across Los Angeles and nearby counties like Riverside County and San Bernardino County.
Local advisors who track the numbers weekly
We study pending counts, price cuts, Sales Data, and days to pending every Friday. That habit lets us spot momentum shifts before they hit big reports from the California Association of Realtors. We price and bid from fresh facts, not last quarter’s chart. Clients get that edge in writing, with comps and timelines they can trust. This discipline keeps deals smooth and goals intact.
Private listings and pre-market access
Our network surfaces private showings, quiet listings, and agent-only previews. These options give buyers first looks and sellers measured launches. Off-market solves privacy needs and reduces foot traffic. Pre-market testing lets us set the right list price before the blast. We use both to position you a step ahead in the CA Housing Market.
Concierge prep and legal advantages at close
We coordinate inspections, painters, landscapers, and stagers so you launch on time. Our disclosures read clean and complete, which builds trust with buyers and appraisers. We negotiate credits that protect net without risking the deal. Legal review eliminates loose ends that could delay funding. That combination delivers results clients feel on closing day.
Work the market with Truline Realty before you list or bid
Our services at Truline Realty bring weekly micro-trend tracking, off-market options, and airtight contracts that protect you at every step. At Truline Realty, we help you price to the last validated comp, prep for top-dollar photos, and structure credits that solve payment math without hurting value. Use our Search LA Homes for Sale to monitor actives and pendings, then plug into our Sell My Home in LA process when timing is right. If you own rentals or ADUs, our Property Management Services keep tenants and maintenance in sync while you plan your next move. When you need clarity fast, we deliver it with data and calm execution.
In summary…
Here is a quick recap you can act on today, with simple points that tie back to the data above.
- Prices over the decade.
- Nominal prices climbed from 2015 to 2022, then flattened into a steadier 2024 and 2025 channel.
- Real-dollar gains still look positive, but the slope eases after inflation.
- What moves prices most.
- Rates and jobs drive short-term moves, while scarce land and schools protect long-term value.
- Insurance costs and Wildfire risk now shape budgets and comps in hills and canyons.
- Neighborhood and tier takeaways.
- Westside and beach pockets hold a premium. Valley and Eastside offer value and space.
- Entry-level reacts fastest to rates. Luxury follows quality and privacy more than monthly math.
- Timing and tactics.
- List in late spring for peak demand. Shop in late fall for leverage.
- Clean pricing and credit strategy beat haggling. Off-market access adds real edge.
- Data sources to trust.
- Pair MLS Reference ID closings with California Association of Realtors releases, county Sales Data, and your Inventory Index.
Tie these points to your street and your budget, and the path gets clear. Your timeline and life stage decide the right move, not a headline.
FAQs
How is median home price calculated in Los Angeles?
The median is the midpoint of sales for a given period. Half of the homes sold for more and half sold for less. It changes when the mix of home types changes, which is why some months show jumps without a shift in underlying values. We cross-check medians with repeat-sales indexes, price per square Footage, and MLS Reference ID closings to confirm the read. For pricing your home or writing an offer, the median frames the conversation while nearby comps close the loop.
Which L.A. neighborhoods saw the fastest growth in the last 10 years?
Premium coastal and Westside pockets led gains thanks to scarce land, schools, and lifestyle draws. Eastside and Northeast L.A. also posted strong growth as cafés, parks, and transit improved. Select Valley zip codes with top-rated schools delivered steady appreciation with more space for the dollar. Downtown showed mixed results that depended on building quality and HOA health. Beyond Los Angeles, Santa Barbara County and San Luis Obispo also posted durable gains tied to coastal scarcity.
When is the best time to buy or sell in L.A. based on seasonality?
Most sellers win in late March through early June when buyer pools run deepest. Buyers who want leverage often target late October through mid December when competition thins. Beach and school-driven areas hold summer strength longer, while downtown condos turn flexible earlier. Your best month depends on school calendars, weather, and your life events. We match timing to your street and your goals.
How do mortgage rates affect Los Angeles home prices?
Rates change monthly payments, which changes the size of the buyer pool. When rates drop, more buyers qualify and bidding tightens on the best homes. When rates rise, buyers shift to smaller homes, different areas, or condos. Sellers who understand rate math can structure credits that keep price intact. These shifts play out within weeks, so planning ahead with your lender matters.
Will Los Angeles home prices drop in 2026?
Outcomes hinge on rates, jobs, and supply. If rates fall and supply stays tight, prices can rise modestly. If rates stay higher for longer and new listings climb, prices may flatten or slip in specific corridors. Long-term scarcity, schools, and coastal demand support values even through soft patches. We plan for multiple paths and shape your offer or list strategy accordingly.


